Home > Welcome to ePB > ePB Features > Reporting > Types of Reports > Sales By Department (Grouped By Store)
The Sales By Department (Grouped By Store) Report allows you to view a department's sales, grouped by store.
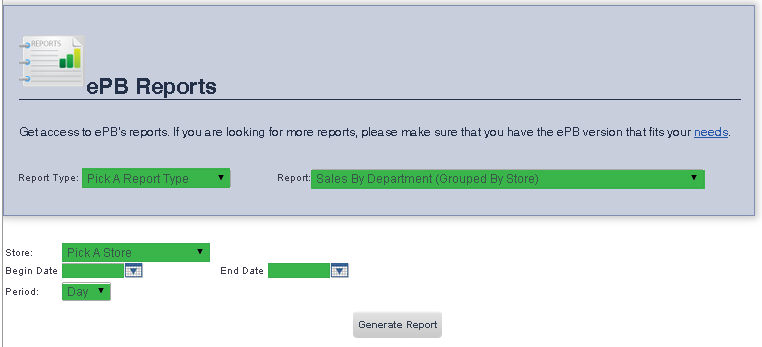
To get to the Sales By Department (Grouped By Store) Report select Reporting from the Main Toolbar and then click View/Print Report. On the View/Print All Report Page, select Sales By Department (Grouped By Store) from the Report drop down menu.
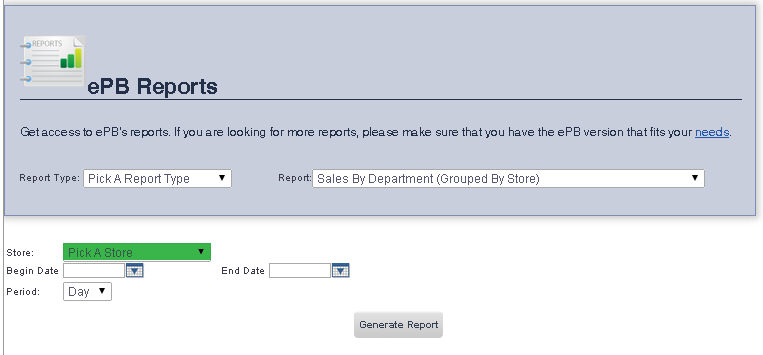
1. Ensure that Pick a Store is selected from the Store drop down menu.
2. Ensure that Price Book is selected from the Price Book drop down menu.
3. Enter the date you would like the report to begin on into the Begin Date text box, or select one using the calendar tool to the right of that text box.
4. Enter the date you would like the report to end on into the End Date text box, or select one using the calendar tool to the right of that text box.
5. Ensure that Day is selected from the Period drop down menu.
6. When you are finished, click the Generate Report button.
The store totals for the department's dollar sales, quantity sold, and percent of total sales will be displayed.
If you would like to view a report for a particular store:
1. Select the store you would like to view the report for from the Store drop down menu.
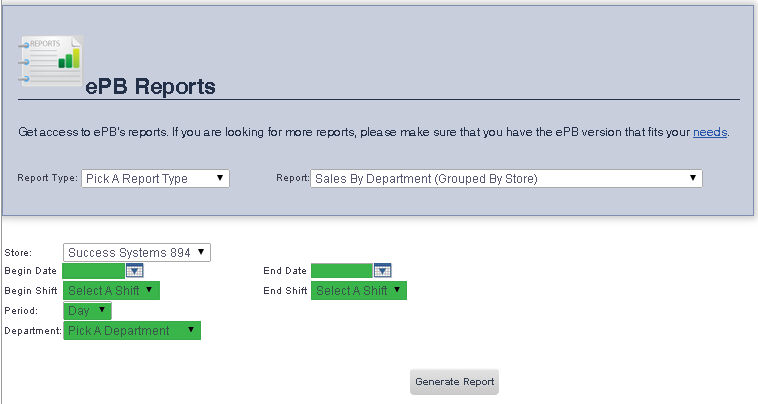
2. Select the price book you would like to view the report for from the Price Book drop down menu.
3. If you would like to view the report by a date range, enter the begin date into the Begin Date text box, or select one using the calendar tool to the right of that text box, and then enter the end date in the End Date text box, or select one using the calendar tool to the right of that text box.
4. If you would like to view the report by a shift range, select shift you would like the reports to begin on from the Begin Shift drop down menu, then select the shift you would like the reports to end on from the End Shift drop down menu.
5. If you have chosen to view the report by a date range, select Day from the Period drop down menu. If you have chosen to view the report by a shift range, select Shift from the Period drop down menu.
6. Select the department you would like to view the report for from the Department drop down menu.
7. When you are finished, click Generate Report.
The store totals for the department's dollar sales, quantity sold, and percent of total sales will be displayed.
frmReports.aspx and frmReportWrapper.aspx